Home
The Personalised Home Page is designed to give you an overview of your activities and the progress of your projects, as well as quick access to various tools and resources. This guide will help you navigate through the home page and utilise its features effectively.
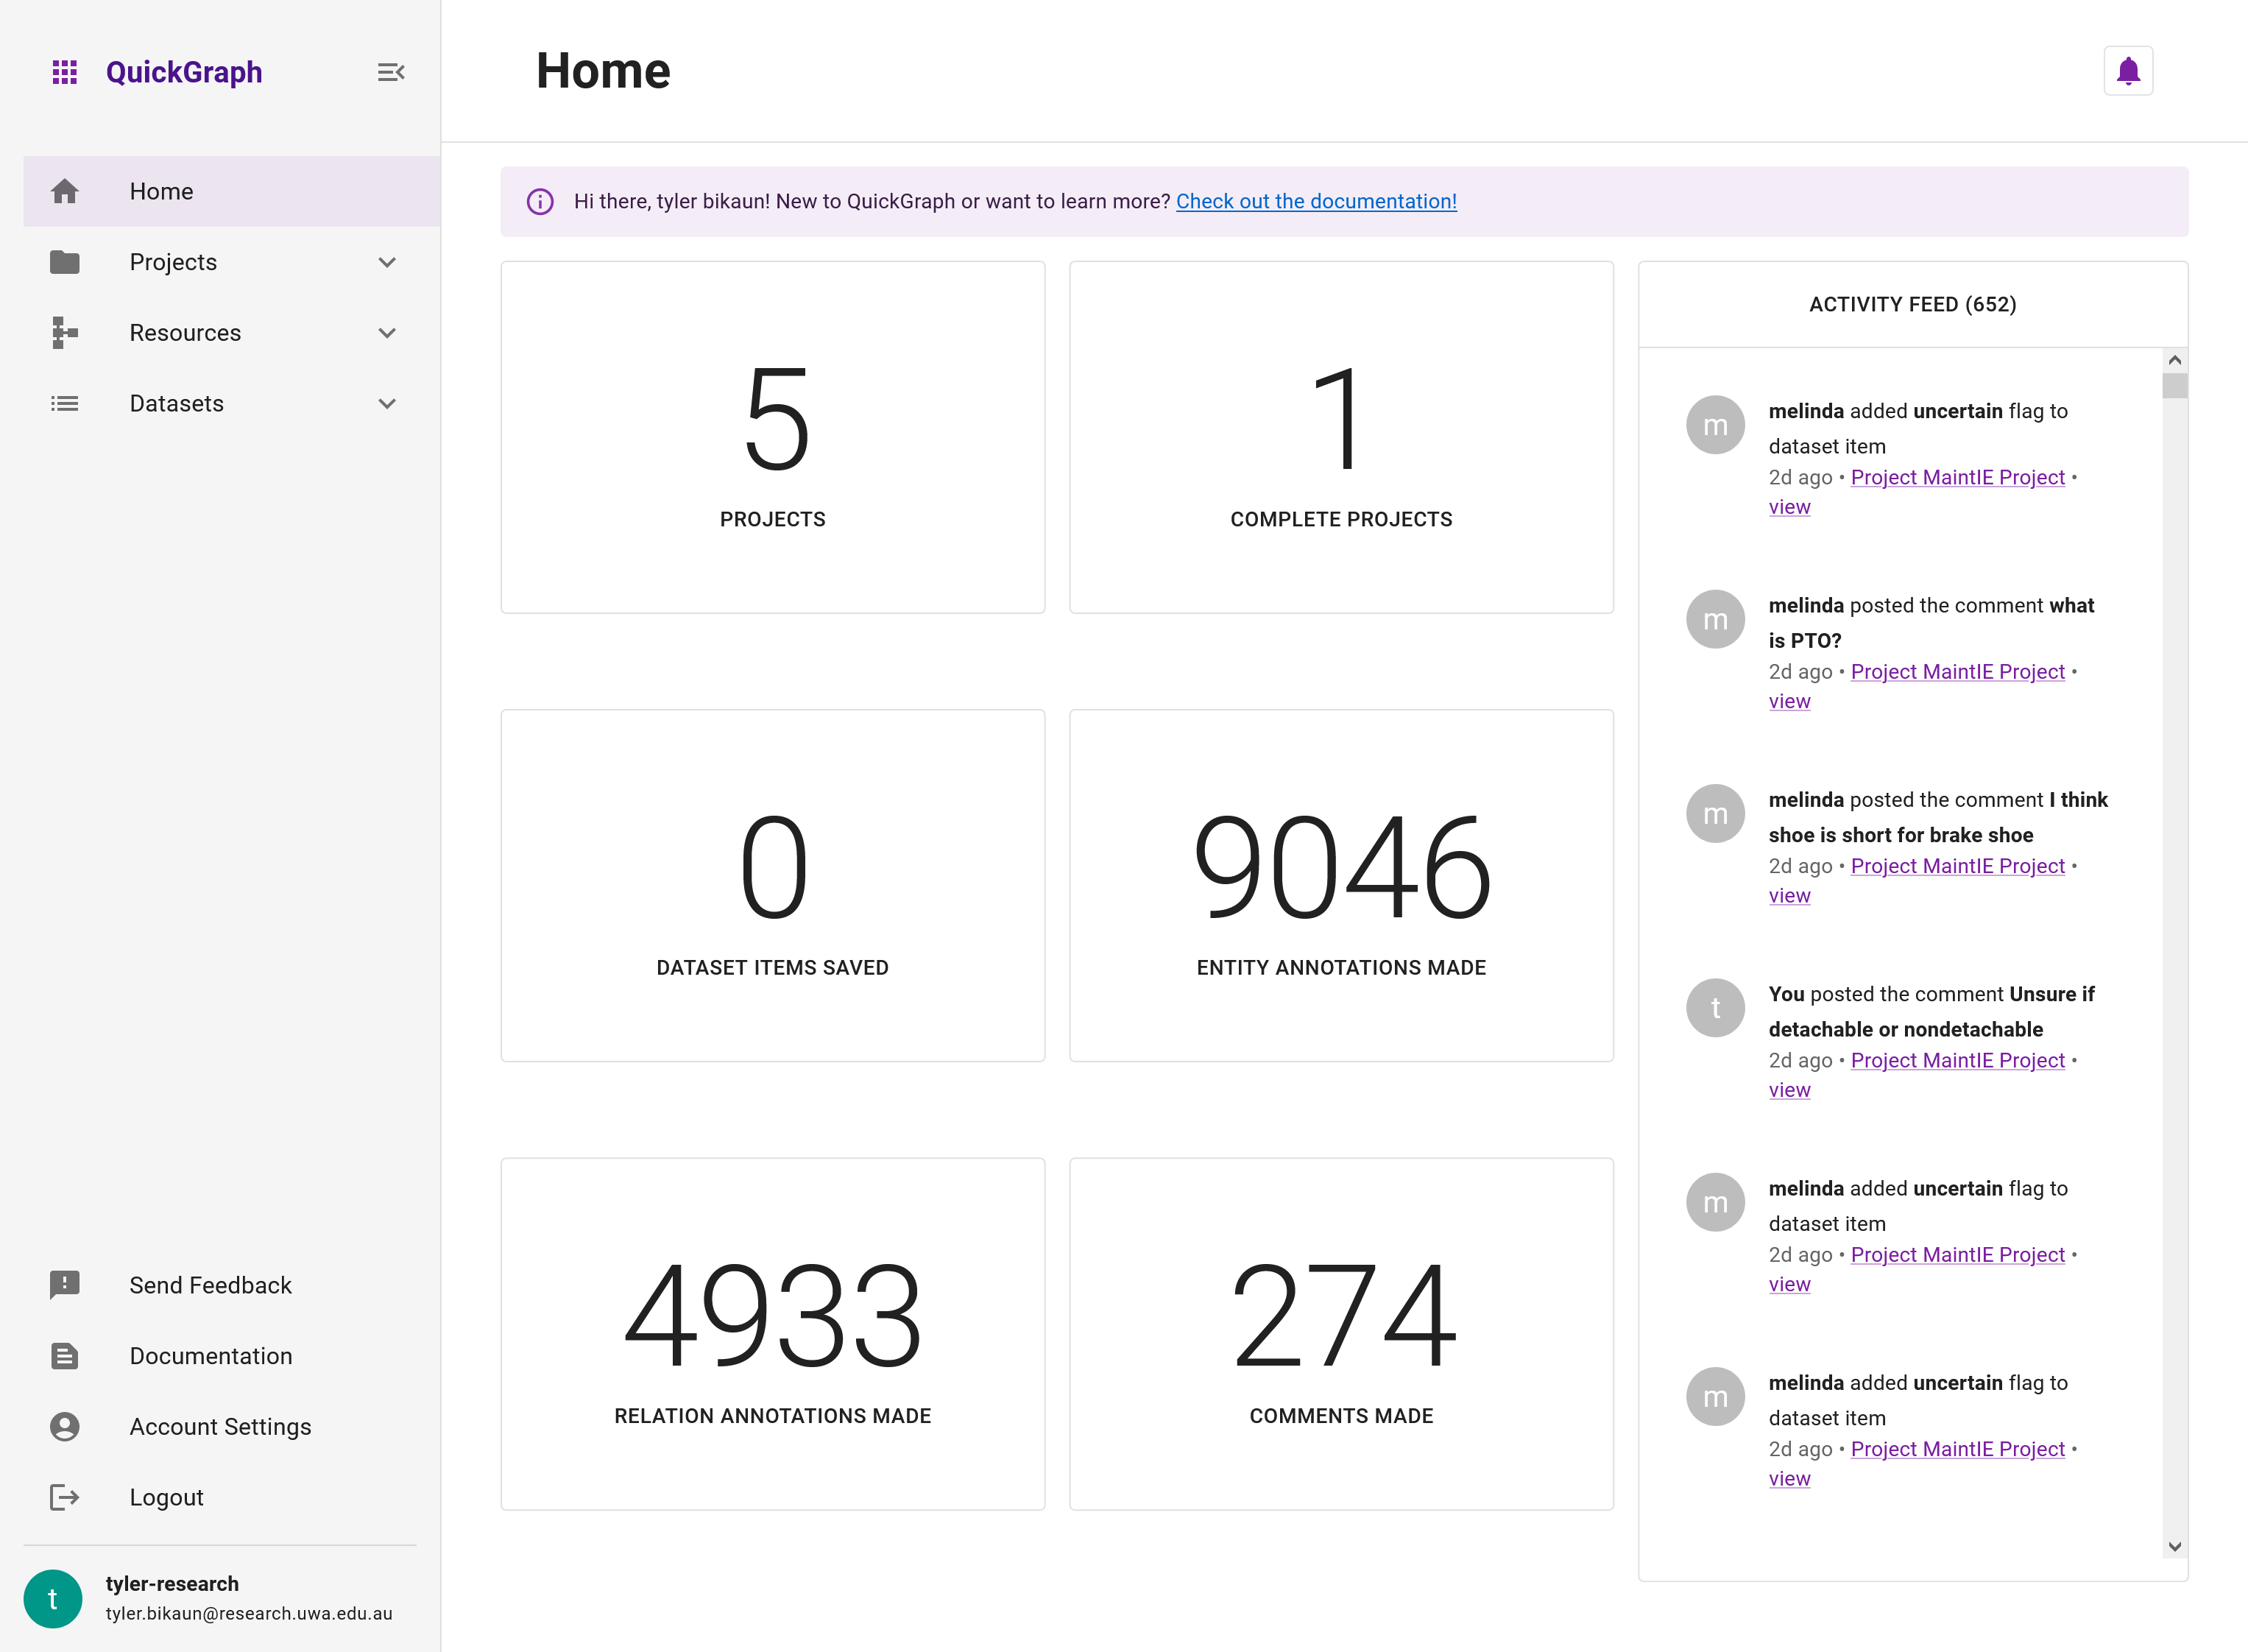
Home Page Overview
Upon logging in, you'll be greeted by the personalised home page, which contains the following sections:
- High-Level Metrics
- Activity Feed
1. High-Level Metrics
This section provides a snapshot of your overall progress across all projects. It includes the following key metrics:
- Number of Projects: The total number of projects you have created or participated in.
- Number of Complete Projects: The total number of projects that have reached 100% completion.
- Dataset Items Saved: The total number of dataset items you have saved across all projects.
- Entity Annotations Made: The total number of entity annotations you have made.
- Relation Annotations Made: The total number of relation annotations you have made.
- Comments Made: The total number of comments you have posted on projects.
2. Activity Feed
The activity feed allows you to stay informed about recent activities on projects your manage or are involved in, including updates made by you and other collaborators. The feed displays the following information:
- Comments: Shows recent comments made by you and your collaborators on projects.
- Flags: Displays any flags raised by you or your collaborators on projects or annotations, indicating issues that require attention or further discussion.
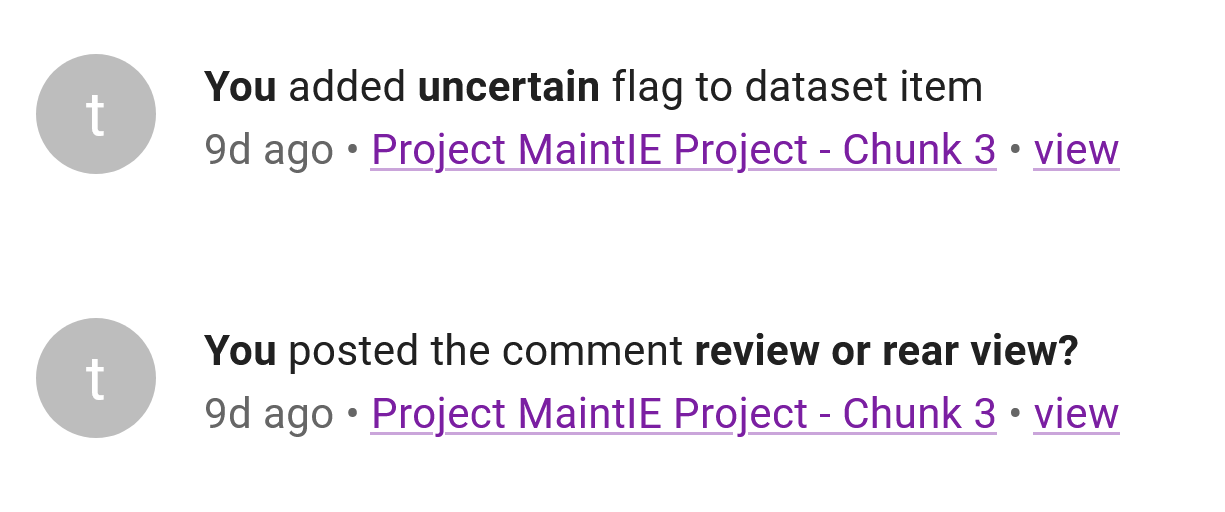
You can click on an activity to navigate directly to the relevant project or dataset item for quick access.
Below are two items from the user's activity feed: a flag application and a comment post. Here, clicking Project MaintIE Project - Chunk 3 will go to the project dashboard, or view will go to the exact dataset flagged or commented upon.
Navigating the Home Page
Easily navigate through QuickGraph by utilising the sidebar located on the left side of the page. This menu offers access to various sections:
- Projects: Explore and manage your projects, as well as those shared with you by other users.
- Datasets: Oversee and organise all your datasets.
- Resources: Supervise and maintain your resources.
- Feedback: Reach out to the QuickGraph support team for assistance.
- Documentation: Access a wealth of support resources to help you effectively use QuickGraph.
- Account Settings: Adjust your account customizability settings, to suit your preferences.
Now that you're familiar with the personalised home page, you can efficiently manage your projects, track your progress, and collaborate with your team using QuickGraph. Happy annotating!